As humanity grapples with the global crisis of the coronavirus pandemic, urgent action is needed on multiple fronts. Equipping healthcare facilities, educating the public, implementing measures to prevent the spread, developing drugs, and allocating funds and other resources are some of the priorities for governments and other organizations.
In order to make the right decision in each of these areas, decision-makers rely on the insights and analysis that data reveals. Given the tremendous advances in the area of data analytics, this science is playing a huge role, in a variety of ways, in tackling the current pandemic.
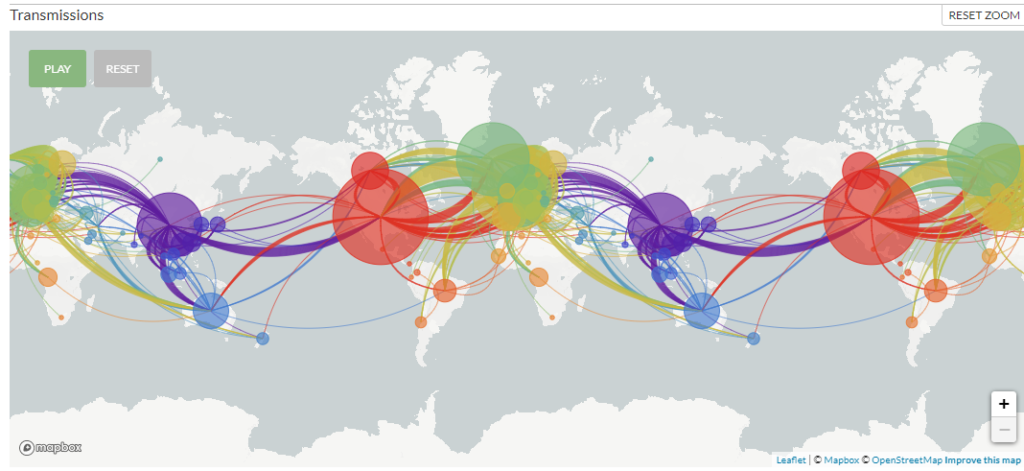
Nextstrain.org has published this powerful visualization showing how the coronavirus pandemic spread and how the virus mutated as it moved around the world. The timeline can be viewed as a video on their site. Such analytic and data visualization tools are extremely valuable to medical researchers, public health officials, and members of the public to better understand the pandemic and improve response.
Data first picked up ‘unusual activity’ due to coronavirus before publicly known
On December 30, 2019, nine days before the World Health Organization statement alerting people about a novel coronavirus, an AI-based platform identified unusual pneumonia cases occurring around a market in Wuhan, China. How could this platform, developed in Canada, pick up the signs?
This was possible as the platform was processing large volumes of data each day with the aim of identifying threats from infectious diseases as early as possible. Natural language processing and machine learning were used to collate and interpret data from hundreds of thousands of sources. Some of the sources were statements from official public health organizations, social media, livestock health reports, and demographics.
In hindsight, it’s fairly obvious that the world did not take full advantage of the nine day head start the data provided because, of course, no one knew at that time how bad the pandemic would become. But, the power of data analytics to identify, predict and, hopefully, prevent the next epidemic is clear.
Data modeling showed what control measures are needed
In mid-March, Imperial College London published data projections showing how different control measures would alter the trajectory of the disease.
The study is based on the population distribution of the USA and the UK, then the number of persons an individual typically comes in contact with is considered, and the infection pattern of the virus is factored in. In this way, the number of people likely to be affected by the disease is estimated.
High-resolution population data was used in order to enable modeling at the individual level. Typical household size and age distribution were taken from census data. Average class size data was considered to estimate the number of contacts in school or at the workplace. Average commute distances were also used to model the contacts of an individual.
Once the population and the number of contacts of each individual had been modeled in this manner, the propagation of the virus had to be considered. The researchers were dealing with limited availability of information about the characteristics of the coronavirus. They assumed an incubation period of five days and that transmission starts 12 hours before the onset of symptoms. The percentage of hospitalized cases that would require critical-care facilities was taken as 30 percent, and the overall fatality rate was assumed as half of those in critical care, and biased toward the elderly, etc.
With this working model of the pandemic in place, it was possible to try out different scenarios. What if we did nothing? Or what if we limited the movement of individuals and minimized social contact and all the scenarios in between?
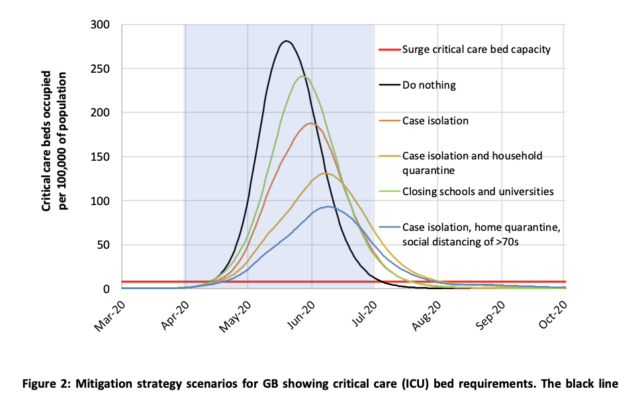
The data model clearly showed that if no steps were taken, critical care infrastructure would be grossly inadequate to handle the number of patients. The importance of “flattening the curve”, or staggering the number of new cases over a longer period so as not to overburden healthcare facilities, became undoubtedly clear to decision-makers as well as the public. The model clearly showed that aggressive suppression measures would need to be in place until a vaccine is developed.
Genetic data being analyzed to better understand susceptibility
Why do some people contract the coronavirus while others don’t? Why do some suffer far more severely than others? And why do some die? Coronavirus has been found to be strangely selective. Research studies are analyzing the genomes of patients in order to identify genetic variations that explain the differences in clinical outcomes.
Research teams spread across the world in countries such as the USA, Finland, and the UK are now analyzing genetic data of coronavirus patients from different countries, with the aim of identifying susceptibility genes. Biobanks that have genetic and health data of large numbers of individuals are collaborating and sharing data for this research.
Data analytics methodologies and technology platforms enable such research that involves huge data sets to be analyzed and interpreted. Powerful data analytics tools today can also process at the high speeds which are necessary in the race against this pandemic.
At this juncture, the two most important objectives for the entire world today are the development of a vaccine for prevention and an effective drug for the treatment of the coronavirus. Both these objectives involved the analysis of large data sets. At this point, while lives are being lost to this pandemic, the speed of analysis is critical. Medical science will continue drawing on the full capabilities of data analytics and AI in the war against the coronavirus pandemic.